![]() My Programs
My Programs
Family Finances
HTML word-counter
HTTP server
Web Browser
ROBOS
Neural Networks
Introduction
Multi-Layer Perceptron
Summation Function
Transfer Function
Complete Neuron
An MLP Program
Training The MPL
Applications
This program supplies the functionality originally provided by a series of illustrative Java applets embedded within the web pages to which they pertained. However, with the retrogression in web technology that has taken place since 2017, these applets won't work in current web browsers and therefore have been replaced by screen shots from this program.

This program is written entirely in 'C' using only X11 windowing: no external graphics or widget libraries are necessary. To run this program yourself, download the file famfin.zip into a convenient directory. If you are running 64-bit Linux, open a terminal in that directory and enter the command './famfin'. The program window illustrated above should open. If you are running a non-Unix-based operating system or feel uncomfortable running an executable from an 'unknown' source, scrutinise the source file famfin.c and, once you have verified that it is doing nothing untoward, compile it on your own computer and run it as above. The compiling instructions are near the beginning of the source listing. For non-Unix operating systems you may need to edit the source code to include different source libraries and accommodate other proprietary requirements.
The program is presented in a 640 by 480 pixel internal window format. That's the same size as the screen of the original PC VGA standard. On a modern computer monitor it is small enough to be visible alongside other programs such as an open web browser or text editor. The program has 8 tabs. That is, it has effectively 8 different screen presentations:
This tab [illustrated above] shows the current account balances for husband, [blue], wife [pink] and both [green] for the selected year shown on the menu on the right-hand side of the graph. The red horizontal line shows the DSS Savings Limit Penalty Threshold at which Welfare payments are reduced if the combined husband + wife savings exceeds this level.
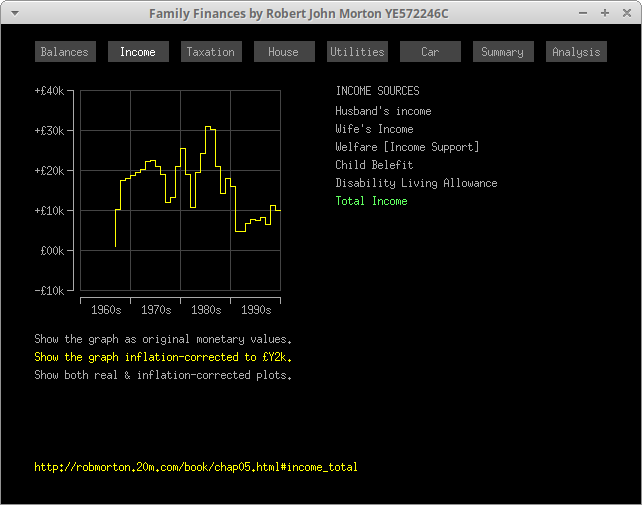
This tab shows a graph of the family's income over 4 decades from all sources both individually and collectively.
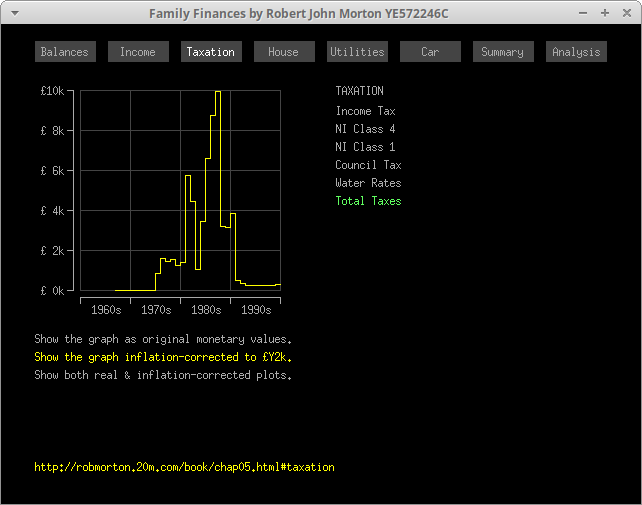
This tab shows a graph of all the forms of direct taxation paid by family members over 4 decades both individually and collectively.
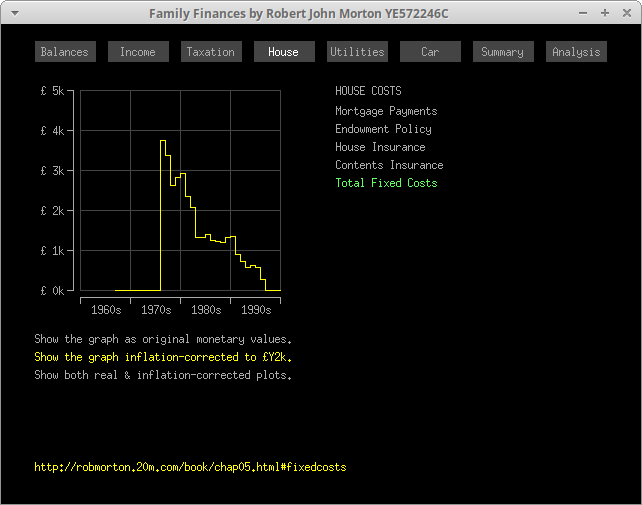
This tab shows a graph of all the costs for the family's house [the building] paid by the family over 4 decades both individually and their total.
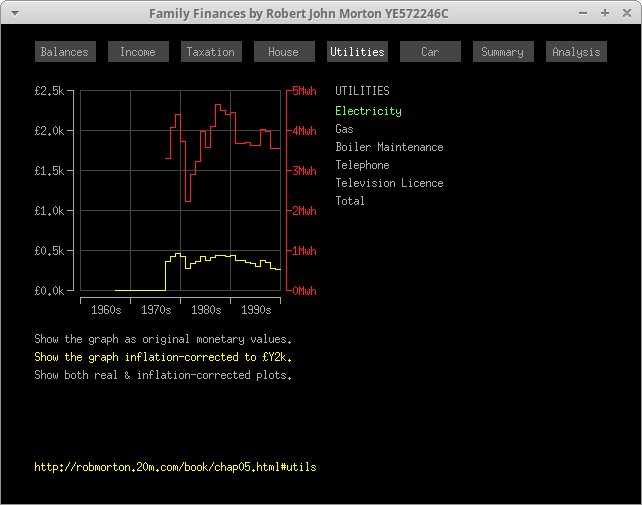
This tab shows a graph of all the costs for the family's utilities consumptions — electricity, gas, boiler maintenance, telephone, television licence — paid by the family over 4 decades both individually and their total. The electricity and gas graphs show also the annual energy consumptions in kilowatt-hours.
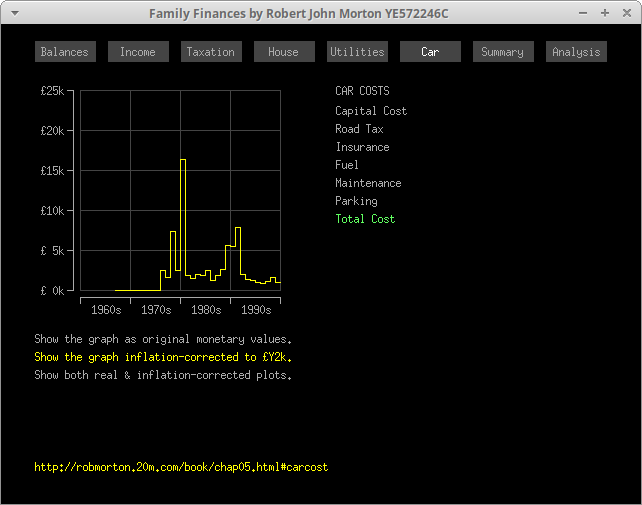
This tab shows a graph of all the various costs associated with the family's car paid by the family over 4 decades both individually and their total.
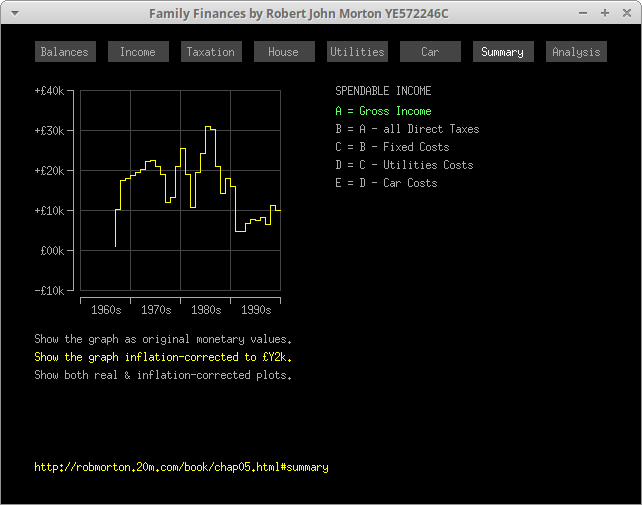
This tab shows a series of 5 graphs to provide a view of the family's gross income and its 'spendable' incomes when all direct taxes are deducted, when all fixed costs have also been deducted, when utilities consumption costs have also been deducted and finally when the cost of the family car has also been deducted.
This tab shows a series of 8 graphs providing a 'bottom line' analysis of my family's income and the challenge for survival we endured during the late 1980s and the whole of the 1990s. It shows our spendable income on our austere Survival Budget both with and without the cost of our car, and the same for our Degradation Budget, which involved the total amputation of many requisites that are generally considered essential for a humane level of well-being. It shows the levels of both our Survival and Degraded budgets over the decades and finally the bottom line: spendable income per person per day, which, in my opinion, is a disgrace to the country in which we lived. Those were very hard times and caused permanent damage to both adults and children both physically and psychologically.
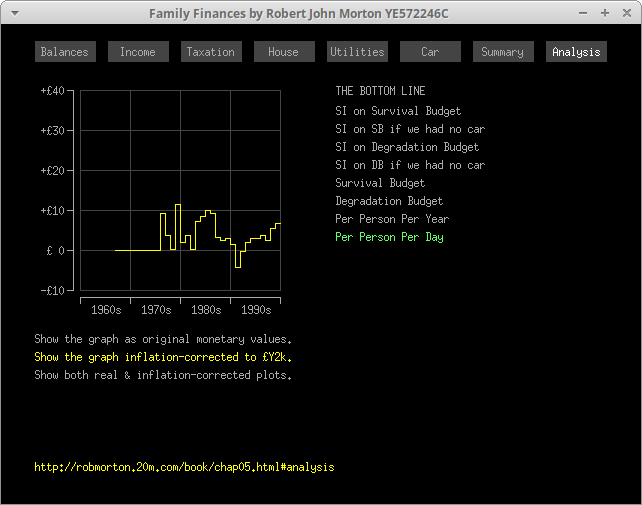
All the graphs illustrated above show values in British pounds Sterling inflation-corrected to the value of the British pound Sterling in the Year 2000 because this provides a universal value comparator over the long period involved. The program provides a 3-item menu at the bottom for selecting to view the original monetary amounts for the values of the British pound Sterling for each year, the inflation-corrected values and also the original and inflation-corrected graphs together.
This program is a useful illustrative aid to have running alongside your web browser when reading chapters 5, 6 and 7 of my book The Lost Inheritance.