To run this program you must first compile it from the source code. Create a new directory in a convenient place. Download the file com.zip. Move it to your new directory. Unzip the com.zip file. The zip file contains the source code com.c plus 12 data files. Open com.c in a text editor. I prefer gedit because of its good source highlighting. Open a terminal. Do a 'cd' to your new directory. The compiling and running instructions are near the beginning of the source listing. If you happen to be running 64-bit Linux, you may be able to skip the compiling process by simply entering the command './com' in a terminal window from the directory containing the files you unzipped.
This program creates, and runs within, a 500 x 400 pixel window. Its content is distributed across 8 tabs. The different tabs are selected by clicking on their respective tab buttons across the top of the window area. Following is a description and operating instructions for each of the 8 tabs. It is useful to have the program running alongside the web browser while reading the following text.
This program is not a transceiver controller. It does not attempt to replace any of the normal front panel controls of a transceiver. The control of a specific transceiver is far better done via its own front panel. The only aspect of what could be termed 'transceiver control' done by this program is to request that a transceiver tune to a specified frequency. The only aspect of what could be termed 'transceiver monitoring' done by this program is to input the signal strength returned for the requested frequency. The purpose of this program is to help the user organise and perceive a full picture of his activities within the radio spectrum.
The main feature of the SCOPE tab is the frequency graticule at the top right. It represents a 300 kHz stretch of the spectrum. Each pixel along the graticule represents 1 kHz. The horizontal frequency scale at the bottom of the graticule shows which 300 kHz stretch of the spectrum is currently displayed. The graticule is 120 pixels high and represents signal strength at the same scale as shown for the S-meter box to the left of the graticule. A scope trace of signals within the given 300 kHz stretch of the spectrum are displayed in green on the graticule.

The signals shown on the scope trace are not 'live'. The purpose of the scope trace is not to show actual signal strength at the time. It is to give a sense of the varying level of expected average occupancy of the spectrum. Obviously there is no single receiver able to cover contiguously the stretch of the spectrum from 0 to 300 kHz. To experiment with Very Low Frequencies [VLF] it is necessary to construct several very specialised receivers. I think that best practice would be to construct a series of receivers, each covering an octave of interest: that is, from a given frequency to double that given frequency.
For instance, if you are interested in listening to the Alexanderson Alternator transmissions on 17.2 kHz every 1st of July, perhaps you should construct a receiver to cover from 10 to 20 kHz plus some kind of tuned loop aerial to pick up its magnetic vector. What this program can do is issue the command to listen on 17 kHz. An adjunct to this program will then select which receiver should be used, switch to it and command it to listen on that frequency. You will then have to adjust your receiver's front panel controls to fine-tune it to 17·2 kHz.
The idea of the SCOPE tab is to be able to select and search specific radio bands. The first step in this process is to select the type [or usage] of the band you wish to search. A list of band types appears in the upper left of the SCOPE tab. You simply click on the band type you want. The clicked band type then highlights and a list of bands of this type appears in the lower panel beneath the frequency graticule. Click on any band name in this list to display the frequency stretch of the band on the frequency graticule. The official boundaries of the selected band are marked on the graticule by a yellow box. Many bands are more than 300 kHz wide. In this case, several 300 kHz stretches are marked with the band name, each followed by a number indicating which part of the band is displayed in ascending order of frequency.
Moving the mouse horizontally across the graticule causes the frequency at the mouse pointer [MOUSE FREQ:] to be displayed above the graticule on the right. The anticipated signal strength at this frequency, as shown on the scope trace, is displayed on the S-meter to the left of the frequency graticule. Clicking the left mouse button selects this frequency for listening [LISTENING ON:] and displays it above the graticule on the left. Clicking the LISTEN button at the bottom centre of the tab illuminates it and sends an "Audio ON" signal to the receiver. Clicking the LISTEN button, when it is illuminated, dulls the button and sends an "Audio OFF" signal to the receiver.
The signals shown in green on the frequency graticule are stored in a file called 'scope.dat'. This file contains exactly 30,000 bytes of data. Each byte represents the signal strength [in the range 0 to 120] over the 1 kHz bandwidth at the frequency [in kHz] corresponding to the byte's position within the file. For example, Byte Number 198 within the file gives the signal strength across a 1 kHz bandwidth centred on 198 kHz. The signal strengths shown in this demonstration version of the program were compiled into a single file from many separate scans of different bands made using an AR86000 scanner. The signal data has been enhanced by software to provide a more meaningful presentation. The AR86000 has a maximum scan resolution of 2 kHz over small scans with even less resolution for wider scans. Eventually, I would like to construct a scanner plus associated input software with a 1 kHz resolution capable of generating the file 'scope.dat' in its entirety. Ideally, I would like it to automatically re-scan the spectrum each day of the week on a rolling basis so that an up to date picture is always available for this program.
The purpose of the SCAN tab is to facilitate scanning of the frequencies on which a particular broadcaster transmits. The panel on the left displays a list of the broadcasters on file. The list is long and can be scrolled using the mouse wheel. A particular broadcaster is selected by clicking on that broadcaster's name. That name highlights in bright white and the list of frequencies on which that broadcaster transmits appears in the panel at bottom right underneath the frequency graticule. The first frequency in the list is highlighted.
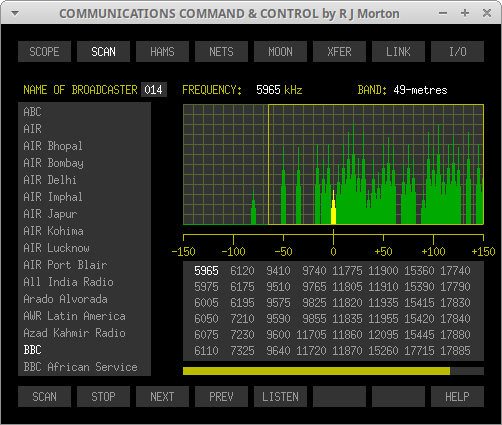
A 'GetFrq' [Get Frequency] command is sent to the appropriate receiver to tune to the highlighted frequency. The part of the spectrum 150 kHz either side of the highlighted frequency is displayed in the frequency graticule with the signal at the highlighted frequency displayed in bright yellow. The name of the broadcast band within which the highlighted frequency lies is shown above the graticule on the right and its bounds are marked on the graticule itself by a yellow box.
To listen to the highlighted signal, click on the LISTEN button in the row of buttons along the bottom of the tab. This sends an "Audio ON" signal to the receiver. Clicking the LISTEN button, when it is illuminated, dulls the button and sends an "Audio OFF" signal to the receiver.
When a broadcaster transmits on more frequencies than can be displayed in the frequencies panel, the list of frequencies can be scrolled sideways using the mouse wheel. You can click on any frequency in the list to listen on that frequency. Clicking the NEXT or PREV buttons, in the row of buttons along the bottom of the tab, causes the next or previous frequency in the list to become highlighted for listening. You can also initiate a progressive scan through all a broadcaster's frequencies by clicking on the SCAN button and halt the scan by clicking on the STOP button.
Apologies. I know the word "ham" when used to refer to an amateur radio enthusiast can, in some contexts, be seen as a little derogatory. I have used it because it is short and thereby suffices well as a Tab Name for my program.
It is useful for a radio amateur or short wave listener to maintain a working list in a file of the hams with whom he has or seeks contact. This program uses such a list. It is a simple text file called hams.txt. To be read-in and used by this program, however, it must follow the simple but strict format, as given at the head of the file itself. The first entry in 'hams.txt' should be you. This will be taken to be the 'base station'.
The left-most button at the bottom of this Tab is marked REGEN. Clicking this button causes the program to re-import the ham data from 'hams.txt', reformat it, compute each ham's distance and bearing from your base station and store it all in a data file called 'hams.dat' for use within the program.
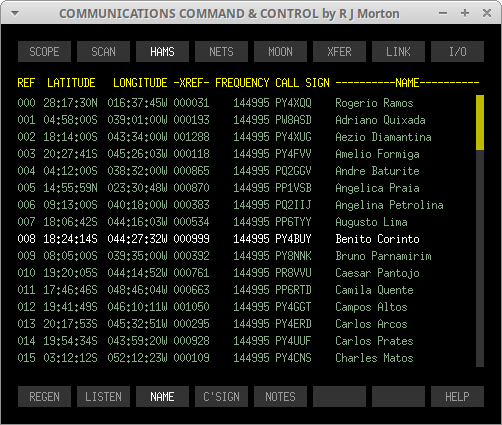
The ham data is displayed as a scrollable list in the tab window. There is one line per ham. To select one of the hams on your list, click on his information line. The line will become highlighted in white. Any other previously selected ham will automatically become de-selected. By default, when you first enter this tab, the NAME button is bright. This makes your hams appear in alphabetical order of their names. If you click the C'SIGN button, it will go bright and the NAME button will go dull. The list will then appear in alphabetical order of call sign. Click on one of the ham's data lines.
Now if you click the LISTEN button, the program sends a message via 'stdout' to your transceiver, telling it to tune to the frequency on which this ham listens for calls. It then sends a second message telling it to turn on the audio. Now you can swing across to your transceiver to listen to him or call him. Clicking on the LISTEN button when it is bright simply sends a message to your transceiver to turn its audio off.
A 'notes' file about the selected station can be created and accessed by pressing the NOTES button. This causes the program to issue a system command to the default text editor 'gedit' to open a text file whose name is the call sign of the selected ham: e.g. PP1VSB___.txt. Note that the file name is padded out to 9 characters using underscore characters. I don't think there are any call signs longer than this and it keeps the programming simple. You can write as much as you like in this file using the opened text editor and it will always be immediately retrievable and editable when you have this particular ham selected [highlighted] in the HAMS tab. When you have finished reviewing or editing a ham's notes file, simply close the text editor.
The concept of the fractal network, in the context of this essay, is of a potentially global communications network, which comprises a large number of independent nodes. Nodes may join and leave the network at will, without seriously affecting the overall network to any great extent.
The term 'fractal' comes from the idea that each node of the network acts like an independent atom of valency 5 within a complex-dynamical environment. As such, it connects to 3 or 4 fairly local nodes + 1 or 2 intermediate or remote nodes. It thereby connects as a 'small-world' network, which enables each node to establish a communication session with any other node in the world over a route requiring only a small number of hops.
Every terminal in the network can communicate with any other if both agree that they wish to communicate with each other. Every terminal also has the obligation to be a node, passing on data from a previous to a subsequent node along a route from an originator to a destination.
Inter-node communication is by radio. Each node is equipped with a standard set of transceivers covering LF to Quiet Band. The different characteristics of each band is suited to different aspects of communication. Quiet Band gives short range high data rate. VHF, HF, MF and LF give progressively longer reach at progressively slower data rates. Furthermore, each band has characteristics that suit different purposes and aspects of communication.
The glorious advantage of this kind of network is that its medium of transmission is natural and does not rely on corporate, multinational or sovereign infrastructure.
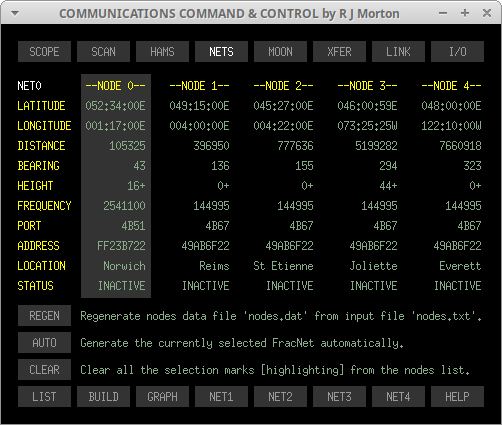
The upper 2/3 of this tab displays the data pertaining to the 5 nodes that make up a particular fracnet. Up to 5 fracnets may thus be constructed. The number [0 to 4] of the fracnet, whose nodes are currently displayed, is shown in white at the top left of the display. You switch between the 5 different fracnets [0 to 4] using the NET1, NET2, NET3, NET4 buttons at the bottom of the tab. For example, clicking on the NET1 button causes the node data for fracnet number 1 to be displayed. When you click a dull button it goes bright. Any previously bright button becomes dull.
If you click on a button that is already bright, it goes dull so that none of the NET buttons is bright. In this case, the data for fracnet number 0 [zero] is displayed.
Below the fracnet data are 3 extra buttons arranged vertically. Clicking the REGEN button causes the program to regenerate its node data from the input text file nodes.txt. If you wish to add, delete or modify nodes data, you do so by editing this file in a text editor. Simply follow the instructions at the head of the file and adhere strictly to the format of the existing lines. This file does not need to contain all the nodes in the world. You need only the nodes that make up your own fracnets, plus all the nodes with which you need or wish to communicate. The '+' sign is optional for latitudes and longitudes.
Clicking the AUTO button causes the program to generate the currently selected fracnet automatically. It looks to see in which directions from your base node most of the other nodes are located. It lists all the nodes in order of increasing distance from the base node for each degree of bearing. It then chooses the nearest node for each of the 5 most populous bearings and installs them as members of your currently selected fracnet. This is probably the best that can be reasonably done automatically.
Ideally, however, you should select the members of your fracnets manually. Thus you can include criteria that the program cannot know. For example, if one of your fracnets works exclusively on the middle HF range, you may wish to select different node distances according to which time of day you communicate and the current phase of the sunspot cycle. For VHF, you may need to take account of the geographical relief in different directions from your location. Obviously, there are many such criteria to which the program is not privy, particularly if you frequently move the location of your base station.
The CLEAR button clears any marked [highlighted] nodes from the nodes list, which I will now explain.

Click the LIST button [at bottom far left]. A scrollable list of the full set of available nodes appears as shown above. Your base station is the first node in the list. The other nodes appear in ascending order of distance from your base station. You may then consider and manually select the nodes that you wish to be members of your currently selected fracnet. To select a node, simply click on its data line. Its line of data will then turn white, indicating that it has been selected. Select up to 5 nodes. The program will only look at the first 5 selected nodes in the list.
You may scroll the list up and down by using your mouse wheel.
Having selected the 5 nodes you wish to comprise your selected fracnet, click the BUILD button. The program then constructs the fracnet using the selected nodes. The original fracnet data display screen then reappears showing the data pertaining to the nodes of your newly built fracnet. Click the CLEAR button to clear the marked nodes from the list.
There is an alternative way, which you may prefer, of selecting the nodes for building a fracnet.

Now click the GRAPH button. A graph appears as illustrated above. The horizontal scale covers the 360 degrees of bearing from the base node [one pixel per degree]. The vertical green lines indicate the number of nodes that exist within each degree of bearing. Up to 25 nodes are indicated. Beyond 25, the line indicates 25 but turns red. You should see a blue vertical line at bearing 000. To select a particular bearing, click anywhere on the graph at the horizontal position for that bearing. Above, is shown the case where the user has clicked on bearing 109.
Click on the green line at bearing 223. The vertical blue line then appears at bearing 223. If you can't quite click on the exact position you want, clicking on the '<' and '>' buttons, to the left of the graph's horizontal scale, allow you to to inch one degree at a time leftwards or rightwards respectively.
This enables you to select the best bearing for each of the 5 nodes of the fracnet you are building. Suppose you have selected bearing 223 as a bearing on which you would like to have a node for your fracnet.

Now click the LIST button [sixth button down on the vertical column of buttons]. The scrollable list of nodes on bearing 223 appears as shown above. Nodes are listed in ascending order of distance from your base node. Only one node can be selected. If, after selecting a node, you click on another one, the previously selected node becomes de-selected. You select a node by clicking on its data line, whereupon it will turn white. You can de-select a selected node by clicking on it, whereupon its data line will become dull green again. Now select the node you want for this bearing.
Now click the bright LIST button. It becomes dull again and the graph is redisplayed. On the vertical column of buttons are 4 buttons labelled NODE1, NODE2, NODE3, NODE4. If they are all dull [grey], then the node you just selected from the list will be node zero. Click the NODE1 button. It becomes bright. Now go through the procedure again of clicking on a bearing on the graph pertaining to the next bearing on which you wish to have a node for your selected fracnet. Then click the LIST button again and select one of the nodes on the list and then click the bright LIST button so it becomes dull and the graph is re-displayed. Go through the same procedure for NODE2, NODE3 and NODE4. I shall stick with NODE0 [i.e. none of the NODE buttons is bright, as shown above].

Having selected the 5 nodes you wish to comprise your selected fracnet, click the BUILD button. The program then constructs the fracnet using the selected nodes. The main fracnets display screen then reappears showing the data pertaining to the nodes of your newly built fracnet. Click the CLEAR button to clear the marked nodes from the list. Now click the GRAPH button again and then the BRGS button at the top of the vertical column of buttons. Five vertical yellow lines appear. These mark the bearings of the 5 nodes that you selected for your new fracnet.
Click on the bright GRAPH button to return to the main fracnets screen. Now click in the area of the data pertaining to one of the 5 nodes of the selected fracnet. The node's name/number and its associated block of data gain a dark grey shaded background. This node is thus now selected and consequently you may initiate a link to this node. How to do this is described later in the section on the LINK tab.
To establish your relationship with the global network, you must now use the LINK tab to initiate a connection to each of the 5 nodes of your selected fracnet. Then you will be able to use the XFER tab to communicate with any destination node within the global network.
I have only gone through the procedure for building one fracnet. To build the other 4 fracnets, you need to click on its appropriate button NET1, NET2, NET3, NET4 across the bottom of the NETS tab.
By default, when first entering the MOON tab, the TRACK selector sub-tab is displayed. However, to return to it from another sub-tab, you need to click on the TRACK button.

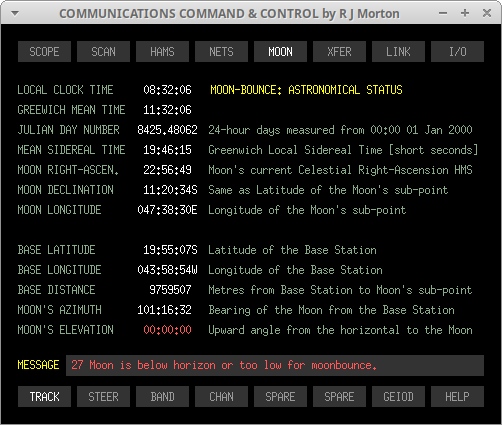
All the necessary data pertaining to the moon appears live in real-time, including the azimuth and elevation commands to maintain an antenna pointed directly at the moon. The azimuth and elevation [in radians] is output directly to antenna steering servos. A fully illustrated description of the tracking software and its program coding in 'C' is available at this link. The purpose of this moon-tracking antenna steering program is to facilitate direct long-range point-to-point radio links using moon-bounce.
While the moon is above the horizon sufficiently high for moon-bounce communication, the moon's elevation is shown in green and the "Tracking the moon..." message is displayed in the message field below. When the moon is below the horizon or not sufficiently high to facilitate moon-bounce communication, the moon's elevation is shown as zero in red and the red message is displayed as shown below.
To establish moon-bounce communication, you first need to select a radio frequency band and also the type of modulation to be used. This is done in the BAND tab as shown below.

Click on the BAND button at the bottom of the tab window. Then click on the vertical buttons for the modulation type and band you wish to use. Now click on the SCAN button at the bottom of the right-hand vertical column of buttons. This will cause a command to be sent to the appropriate receiver to scan for the quietest frequency currently available for your down-link channel. During the scan, the yellow message is displayed as shown below.
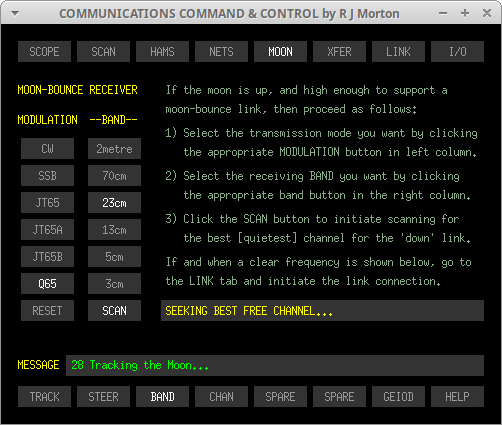
If and when the best [quietest] channel is found, the green message is displayed, as shown below, showing the frequency of the quietest channel

If, for any reason, the receiver is unable to locate a quiet channel or if you attempt to find a channel when the moon is down, the following message is displayed in red.

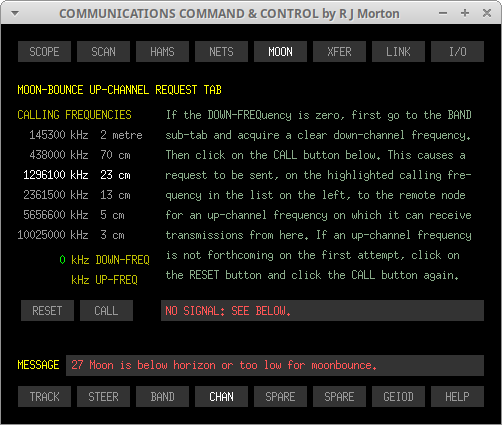
It is now necessary to inform the person you are trying to contact about the frequency of your down-channel and request from him an up-channel frequency on which he will receive transmissions from you. You send this request via the band's standard calling channel. To do this, you need to click on the CHAN button at the bottom of the tab window.
If you do this before you have found a quiet down-channel, or the moon is down, the down-frequency will be shown as zero. Attempting a CALL in this case will result in an error message, as shown below.
If a down-channel frequency has been acquired, it will be shown in the CHAN tab window, as shown below.
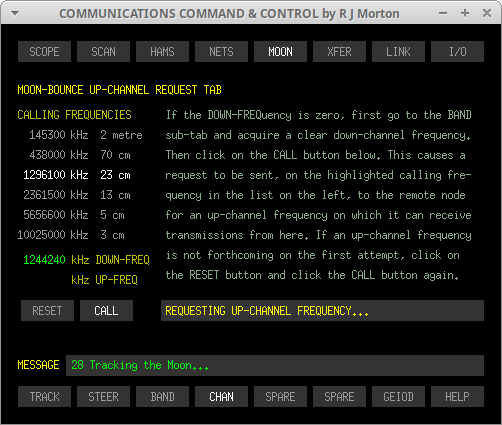
If you receive a reply with an appropriate up-channel frequency, the up-channel frequency [UP_FREQ] will be displayed along with a confirmatory message, as shown below.

You now have up and down channels for moon-bounce communication. Now go to the XFER tab to exchange data or engage in a digital voice call.
If the remote station does not answer with an up-channel frequency for you, a red error message to this effect is returned. If no down-channel frequency has been acquired, a red error message to this effect is displayed instead, as shown below.


Click in the GEOID button [bottom left] of the tab window. A list of the established geoids appears. At the top left is a means of selecting whether a specific geoid is used or whether the program automatically selects the best geoid to use according to the location of the base node. Here you can click on MANUAL or AUTOMATIC to highlight the option you prefer. By default, the geoid used is selected manually. This is the better option for most situations in which base nodes don't tend to be relocated often. The default manually selected geoid is the GRS80, which is the same as the WGS84.
You can exchange data or conduct a digital voice call with the radio amateur:
- currently selected on the HAMS tab,
- currently selected as the destination on the currently selected fractal net,
- for whom you have set up moon-bounce channels on the MOON tab.
To do this, you need to click on the XFER tab, which appears below.

Now click on the DEST button to cause a full list of available network nodes to be displayed on the right of this tab window, as shown below.

Select a destination node to which you wish to send your file or make voice contact by clicking on its data line in the list. Its data line will then turn white. Any previously selected node will then automatically become de-selected. Then click the bright DEST button. The list disappears and in its place is shown the full data for the destination node you have selected, as shown below. You must do this before you can send or receive data or make voice contact.

Notwithstanding, before you can actually transfer data or make a voice call to the destination, you need to establish a link-level connection to the destination or, at least, to the first node in the network route. To do this, you must go to the LINK tab. So now, please click on the LINK tab at the top of the window, whereupon the LINK tab will be displayed as shown below.
The LINK tab accommodates the task of making a link-level connection between your base node and the currently selected HAM, one of the 5 nodes that are members of one of your 5 fracnets, or the currently selected HAM via moon-bounce. The sequence of stages involved in establishing a link-level connection with a destination station are listed on the lower left of the LINK tab window, as shown below.

The default setting is to make contact via the FRACNET, as shown by the highlighted FNET button in the column of buttons in the middle of the window. If you want to contact your destination station directly [for instance, via HF], you can click the HAMS button. The HAMS button then becomes bright and the FNET button becomes dim. If you want to contact your destination station via moon-bounce, click the MOON button. The HAMS button then becomes bright and the other buttons become dim. However, for moon-bounce to work, the moon must be up sufficiently to facilitate moon-bounce and you must have already established a down-channel and up-channel using the MOON tab, as already described. For the moment, let's carry on with an FNET contact.
The panel at the top left of the tab window shows the number [0 to 4] of the currently selected fracnet, the number [0 to 4] of the selected node within it, the location of that node and its current connection status. If the node's current status is INACTIVE then the CONNECT button should be dim and the list of LINK SEQUENCER stages should all be shown in grey.
Click the CONNECT button. It will become bright and the connection sequence will begin. The message line will tell which process is currently taking place. As each stage in the sequence is reached, its name will turn green. The receiver will be switched on and then tuned to the appropriate frequency or channel. It will then seek a carrier signal from the selected remote node.

Once the remote carrier has been acquired, the Lissajous precessing ellipse appears. This shows the gently drifting phase difference between the far carrier and a local parser signal. The LISTEN button brightens and the program endeavours to achieve a quadrature phase LOCK between the parser and the remote carrier. Once quadrature synchronization is achieved, the next time the drifting ellipse becomes circular, it stabilises: it stops drifting and becomes static. In the demonstration version this process is a SIMULation: LIVE operation isn't implemented.

Once a stable circle is achieved, the link sequencer phase modulates the signal with a 16-segment bit frame. Once this is stabilised, the sequencer moves to the DATA CHANNEL OPEN stage at which a full pattern of idle mode data bits is modulated onto the bit frame, giving the pattern shown above. The remote node's status is then shown, in bright green, as CONNECTED. The LINK and MODU buttons are merely for use in verifying the correct working of the sequencer, in circumstances such as after the associated parts of the program have been modified.
Back to The XFER Tab
Click the XFER tab at the top of the window to go back to the XFER tab.

This tab enables you to conduct a digital voice or data transfer session with a remote node in a world-wide fractal network. The stages of the session-level transfer protocol are shown at the lower left of the tab window. See the adjacent screen shot. Each stage in the list is accomplished in sequence from bottom to top. The latest stage is highlighted in bright green. Previous stages are in dark green. Stages not yet reached are in grey. The message line tells what process is currently taking place. Two types of session are facilitated: VOICE streaming and DATA transfer.
If the session were initiated by clicking the VOICE button, the VOICE button turns yellow and the TRANSFER PROTOCOL goes through the first six stages to establish session-level communication with the remote [destination] node. Once the TRANSFER INITIATED stage has been reached, the VOICE button turns bright green and a message advises you that the voice stream is now open. You can now converse with the operator at the remote node. You terminate a VOICE session by clicking the RESET button.
If the DATA button is bright and you then click on the SEND button, the TRANSFER PROTOCOL again goes through the first six stages to establish session-level communication with the remote [destination] node. Once the TRANSFER INITIATED stage has been reached, however, transfer of data starts automatically and the graphic at the top left of the window shows the progress of the transfer. The arrow shows the direction of transfer: from you outwards to the first network node, which is one of the 5 members of your
fracnet. Once all the data has been transferred, the session advances to the TRANSFER COMPLETED stage.
If the DATA button is bright and you then click on the RECV button, the TRANSFER PROTOCOL again goes through the first six stages to establish session-level communication with the remote [destination] node. Once the TRANSFER INITIATED stage has been reached, however, transfer of data starts automatically and the graphic at the top left of the window shows the progress of the transfer. The arrow shows the direction of transfer: from the first network node, which is one of the 5 members of your fracnet, inwards to you. Once all the data has been transferred, the session advances to the TRANSFER COMPLETED stage.
For outbound transfers, the graphic starts 'full' and gradually 'empties' thus showing the proportion of the data that still remains to be sent. For inbound transfers, the graphic starts 'empty' and gradually 'fills up' thus showing the proportion of the data that has so far been received.
The PAUSE button enables you to pause a data transfer. To continue a paused transfer, click the SEND or RECV button again as appropriate. The RESET button cancels whatever session is currently taking place, even if paused.
Data to be sent must be placed beforehand in a file whose name comprises the destination's network address and the port number on which the destination listens. The file's name is thus a 12-character HEX string. The file name extension can be whatever character string you want it to be. Files to be sent are placed beforehand in a subdirectory of the 'com' directory named 'send'. Data received during a transfer is placed in a file whose name comprises the 8-character HEX network address of the sender followed by a 4-character HEX serial number. Files sent and received are generally compressed '.pgp' files containing the intentional data in one large file with qualifying information in a second small file.
Under intended use, a reasonably large number of files would be placed in the 'send' directory for distribution to the various destinations to which they are addressed. The sending processes would then be initiated as a single batch job. This job could normally take place unseen, but could be monitored using the [XFER] tab. Similarly, the program can be set up to listen for incoming data transfers and receive the data into files which it would place in the 'recv' directory. This facility is not implemented in the demonstration version of 'com.c'.
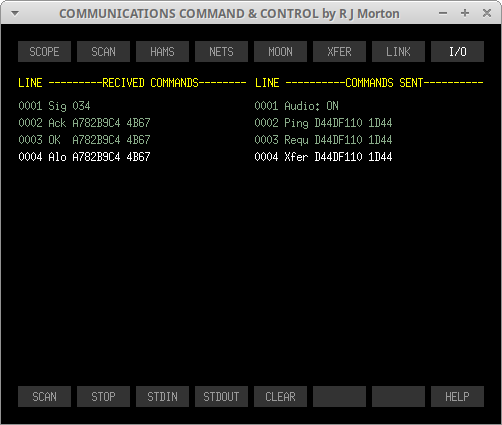
This tab displays the last 16 messages sent by the program via 'stdout' and received by the program via 'stdin'. It is useful for checking and monitoring messages exchanged by the program and a transceiver. It also displays the messages exchanged by the base node and the destination node in a voice or data session conducted by the XFER tab. The screen shot shows the messages exchanged with the destination node during a file transfer session. The SCAN & STOP buttons are live copies of those in the SCAN tab. Thus, a scanning session can be started and stopped from here.
This enables you to watch the exchange of messages between the program and the transceiver to see that communication between them is working correctly. The STDIN and STDOUT buttons respectively enable input from 'stdin' and output to 'stdout'. The STDIN button is not enabled in this demonstration version of 'com.c'. When the STDOUT button is bright, all output messages are sent to 'stdout', which is usually the terminal window within which the program was launched. The CLEAR button clears the currently displayed messages to make a clean start for a new session.
© 21 October 2020, 28 May 2022 Robert John Morton


