Projects during College and While Employed
Bespoke Software Projects [1976-91]
Freelance Technical Writing Projects
My first introduction to computers was a course in 1964 on FORTRAN IId on an IBM 1620. This was later applied to a physics research project which used laser light to measure precise distances. The experimental set-up was as follows:

The FORTRAN program and its data had to be punched up on 80-column cards. It was then fed into the computer's card reader, compiled and run. Output was via a hammer-based typewriter.
While working for the Electrical Research Association [ERA] in 1966, I assisted with their research into the erosion of electrical contacts — particularly those of reed relays — and the nature of the high-speed electric transients produced in a circuit at the instant contact is broken.
For this work I designed and built (using experience from a previous fitting and machine-shop course in 1961) a special controlled atmosphere test apparatus. This I set up in the following experimental circuit to photograph the high-speed transients caused when the contacts broke the circuit.

I also did much work plotting the radiation pattern and gain of various aerial designs using a standard resonant dipole at various distances and directions from the test aerial as illustrated below.

As background for this work I read and greatly appreciated Max Planck's original book 'Electromagnetic Theory'. This work was of great benefit when I moved to the Redifon Flight Simulator Division where I developed software for simulating the radiation patterns of aeronautical radio-navigation aids. Over fifteen years later, I developed more sophisticated software in C to simulate aerial radiation lobes.
While at the ERA I also helped to devise methods of measuring radio interference. This involved the use of many state-of-the-art radio receivers covering the whole of the then-used radio spectrum. One of my most fascinating experiences was listening to the whistlers — the glissando sound effects produced by the radio emissions from powerful lightening strikes echoing round the globe between the ground and the ionosphere.
I spent 2½ formative years writing programs for the Honeywell DDP 124 computer at the Redifon Flight Simulator Division in Crawley, Surrey.
 It was a time of intense systems analysis and assembler programming in which I designed, developed and commissioned the simulation software for various types of aircraft navigation equipments and their terrestrial environments. My whole time at Redifon was occupied on only two flight simulators. The first was the Douglas DC9-30 civil passenger aircraft for Flight Simulators Incorporated in California. The second was the Phantom F4-M fighter-bomber for the Royal Air Force [photo by Richard Cooke, Central Office of Information].
Below is an overview of these flight simulators' generic hardware:

Technical Achievements: During the time I was working on these two flight simulators I either originated or significantly enhanced the following:
A test program to reproduce Lissajous figures on the large-area track recorder to test the linearity of its digital to analogue conversion and its two-axis servo motors.
The first user-friendly interface between the simulator software and the console typewriter to allow program testing using the console typewriter in place of the aircraft instrumentation so that software functions could be tested independently of the expensive aircraft instrumentation and main interface.
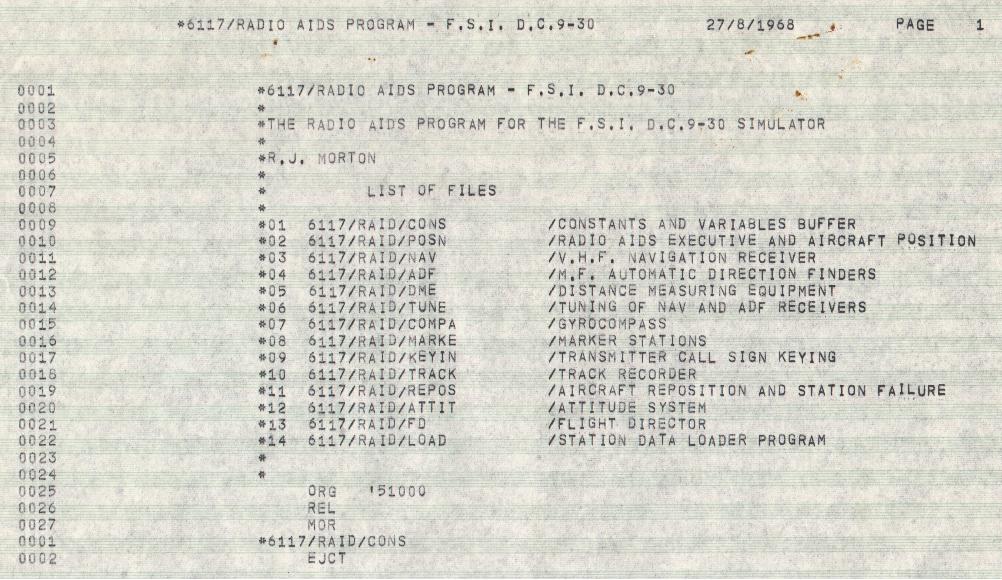
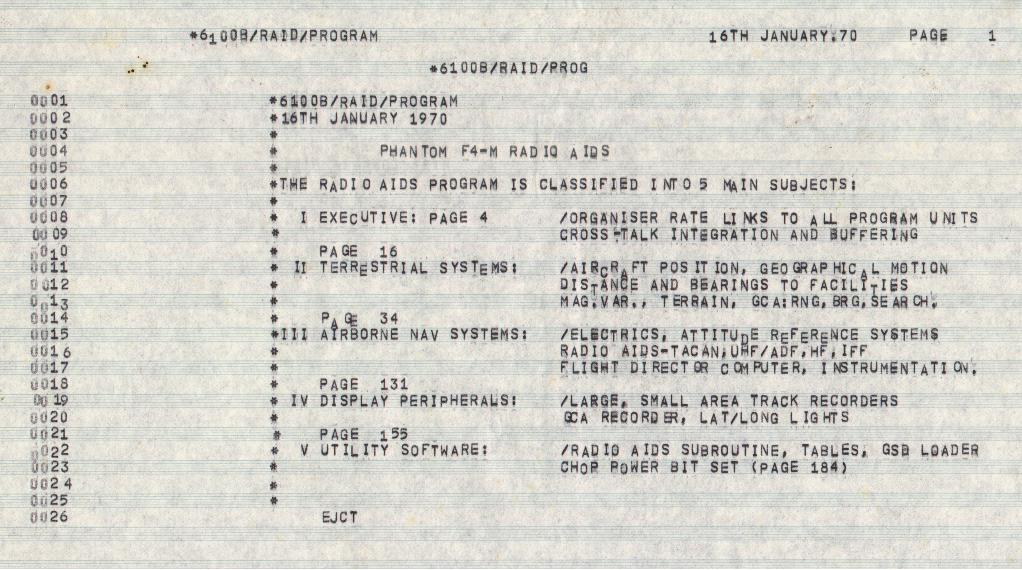
I did most of the systems analysis, data structuring, programming plus all the acceptance commissioning for both the Radio Navigation & Communication systems and the Inertial Platform and Flight Director systems of both these flight simulators. The software was written in DDP124 Assembler. I still have the 'title pages' of my original program listings for the radio aids, navigation and flight director software for the
FSI DC9 and the
Phanton F4M simulators.
System Overview: Below is a generic system diagram of the radio navigation and communications simulation software on which I worked at Redifon.
 GSD: A memory file of details such as lat, long, height, frequency, Morse ident, type (omni, VOR, TACAN, ILS, DME, marker) of the NAV and COM ground stations.
SCAN: a function which does a slow scan of all ground station data to shortlist stations within a zone where stations could be receivable.
LIST: Shortlist of stations which could possibly be receivable (ie a list of pointers to relevant GSD records).
R&B: Function to compute accurate range and bearing of stations on the shortlist using the spherical geometry formulae.
SIG: Function to scale each transmitter's signal strength according to its lobe radiation patterns, eg the horizontal lobe of an ILS localiser or the vertical lobe of a runway marker beacon.
TXs: Data array of all transmitters deemed to be receivable at aircraft's current location, output signals being keyed with station Morse idents.
TUNE: Function to attenuate signal strengths of transmitters according to the receiver's tuned frequency and selectivity pass-band.
O/P: Output of signal strength, ident, distance and bearing for NAV stations and voice for COM stations + graphical representation of these for flight instructor.
Technical Achievements: During the time I was working on this radio navigation and communications simulation software I either originated or significantly enhanced the following:
Design and compilation of radio ground station databases.
Time-optimised computations of both rough (fast) and accurate (slower) range and bearing of radio ground stations.
Simulation of signal strength at a point within the 'elliptical cross-sectioned inverted oil-drop' lobe radiation pattern of a directional radio aerial.
Simulation of HF receiver's selectivity envelope by approximating to the reactance equations of multiple tuned circuits.
Software keying of radio ground station idents in Morse code.
Interfacing to NAV & COM radio controllers and tone generators, and synchro, servo, resolver and logic-driven instrumentation.
Below are the generic system diagrams of the flight director roll and pitch control channels simulation on which I worked at Redifon.

POS1: Aircraft Position: lat, long, height, drift, pitch, roll, azimuth angles and vertical accelerations.
INS: Simulation of the Inertial Navigation System with built-in Earth-rate Drift and Transport Wander effects.
POS2: Positional Data: lat, long, height, drift, pitch, roll and azimuth.
CCA: Compass Compensator/Adapter: takes azimuth input from compass or directional gyro and applies magnetic variation or earth-rate drift compensation.
HDG: Corrected true heading.
FDC: Flight Director Computer azimuth channel: computes the roll correction which the pilot must make to bring the aircraft on to an asymptotic intercept with the pre-set heading or radio navigation station radial.

POS: Aircraft Position: lat, long, height, drift, pitch, roll and azimuth angles plus vertical accelerations.
ALT: Radio or pressure altimeter.
HGT: Radio or pressure height.
FDC: Flight Director Computer pitch channel: computes the pitch correction which pilot must make to bring aircraft on to an asymptotic intercept with the pre-set height or ILS glide slope.
Technical Achievements: During the time I was working on this inertial platform and flight director simulation software I either originated or significantly enhanced the following:
The principles of gyros and origination of the theoretical work on and the simulation of Earth-rate drift.
Simulation of the trigonometric and exponential damping functions involved in a flight director computer in order for it to direct a pilot to an asymptotic intercept of a pre-set compass heading or a prescribed radial of a radio navigation station.
Simulation of the electro-mechanical relay, electronic phase detector, operational amplifier and servo-electric motor-generator functions within an azimuthal compensator and flight director computer.
In 1970, while I was employed by Scicon, London's Air Traffic Control Centre was being automated by means of a system known as 'Mediator', the essence of which is shown below:

The part of Mediator to which I contributed was the flight plan processing system. Based on a triplicated Marconi Myriad 24bit/32k computer with two 6MB disks, this system:
accepted flight plans from airports input by data entry clerks,
allowed each flight plan to be allocated to an air traffic controller as it became active, and
displayed active flight plans to the controller and allowed him to update their progressive status via a touch-sensitive screen.
Together with the annotated radar display, this provided the air traffic controller with the information he needed to advise and instruct the aircraft captain by radio. During my work on this project, I achieved two main objectives:
Used analytical skills to sift out meaningful information from an extremely unfriendly customer requirements specification and to document them clearly in heavily illustrated personal notes which I used to give introductory lectures to new recruits to the project.
Developed and applied a unique but effective mixed diagrammatic and textual style of communicating system information from full overview to deep technical detail in a way which was rapidly and accurately digestible. This made use of both ordinary A4 manuals in conjunction with A1 and A0 size annotated dye-line diagrams.
For 5 years (August 1971 to August 1976) I worked as a technical writer for the ITT Europe Technical Publications Centre which was a case-funded service centre for technical documentation for the ITT System Houses throughout Europe (and later the eastern United States).
My first large assignment was to produce a detailed proposal for the upgrading of the TPC's automation from a simple camera copy production system based on IBM MTST composers to a computerised system covering the full document production task from creative writing to camera-ready copy. Using the most appropriate technology of the day I proposed a system, the essence of which is shown below:

In addition to the final design, I provided a phased implementation plan for the introduction to the new technology and the new working methods for the authors and camera-copy production staff. Having produced the proposal, my next task — which was as large again — was to produce a comprehensive presentation for an ITT Technical Directors' meeting in Brussels in order to market the idea to them to obtain the case funding required. This involved the production of a series of slides which could put over the essence of the system, the way it would be used, and the benefits to the ITT System as a whole in the more efficient production of better quality technical documentation. For the slides, I developed a somewhat unique illustrative style to convey this information quickly and effectively to the busy directors of this large multinational.
One of my first documentation tasks at the ITTE TPC was for the internal electronics architecture and system software of the ITT System 710 — a small voice/data communications system.
My largest software documentation job at ITTE TPC was for the software package for the Metaconta 10C Medium Local telephone exchange manufactured by the Bell Telephone Mfg Co. Antwerp, Belgium (now Alcatel Antwerp). For this I originated and developed a unique diagramming method which could show both the flow of data and the flow of control each separately and distinctly on a single diagram.

A complete representation using this diagramming method of the call processing system of the Metaconta 10C exchange was finally put together on a single diagram measuring 8 feet by 4 feet which became affectionately known as the Bayeux Tapestry. I also originated further diagrammatic methods and standards for depicting such things as the methods and techniques used for transferring control and data to and from routines on different interrupt regimes.
 During 1975-76, I wrote a theoretical introduction, system description and user procedures for special traffic measurement features built into the software of the Metaconta 10C Toll Exchange. This model, which was based on stored program control cross-point technology, was built by Bell Telephone of Antwerp, Belgium to the specific requirements of the Australian Post Office. This task necessitated an exhaustive grasp of the theory and implementation of telephone traffic measurement and I made full and effective use of my mixed text + illustration style.
 The main measurement was the occupancy of each subgroup of signalling devices — the exchange's main resources, which was made for each sampling period throughout the day and presented as a histogram as shown. Exponential smoothing was applied to the successive samples to give a better feel for the daily variation. Offered call rate and call dispersion were measured in a similar way giving the nº of calls per route and the percentage dispersions of calls to down-route exchanges as shown in the example below:

Years later, I drew on the knowledge gained from this project when writing the traffic measurement program for an X25 network management suite.
Ledgers & Payroll System for a commercial vehicle dealer
Payroll System: for a toy manufacturer
Sales Order Analysis System
Equipment Register Program [Sept88+]
News Wholesalers Retail Stock Monitoring System [May-Sep 1988]
X25 Network Management Suite [1989-90]
In March 1978, Sparshatts of Kent Ltd needed to automate their accounting. They asked me to help. Being a relatively new and small Mercedes-Benz commercial vehicle dealer, they had a limited budget. Since this was just before microcomputers appeared on the market, the only options were either a Burroughs-type accounting machine or a large programmable calculator. The latter was chosen because it could be soft-programmed thus allowing full functional flexibility. The configuration below was supplied and implemented completely by me through my own business.

The PC2600 had little memory and no disk operating system. Sharp and its third party providers could offer only trivial software with totally inadequate functionality for the purpose in hand, although the hardware had all the functionality and performance necessary to do the job. Between March 1978 and April 1982, I wrote all the system software and the following application software:
Payroll: Data entry and validation prior to automatic pay run. Bespoke reports giving departmental labour cost analysis, tax and NI to be paid, and a special workshop labour cost analysis giving cost per man-hour and per employee with percentages. Independent functions for maintaining fixed and semi-fixed employee and statutory data.
Sales Ledger: with full transaction listing for each monthly run with running balances for net, VAT and gross, and a control totals sheet at the end. Printout of a monthly statement for each customer on company headed continuous stationery. Automatically produced credit control letters for overdue accounts. Monthly sales analysis report giving categorised parts and labour revenue in both money and percentages of total turnover. Percentage this month's business was up or down relative to the average monthly turnover for the year to date.
Purchase Ledger: inverse of sales ledger.
Warranty Ledger: produced a detailed report for Mercedes Benz giving amounts claimed, received and disputed regarding all warranty work done.
Contract Fleet Servicing Ledger: held details of vehicles on their contract fleet servicing scheme with monthly charges, repair/service costs and profit on each vehicle and for the scheme as a whole.
In 1980, microcomputers started to appear on the market among which was the ITT 2020 (or 'European Apple II'). At the end of March 1980, I bought two ITT 2020 microcomputers, one with a Texas Instruments 825 RO printer and one with a Centronics printer.
A A Gaffney & Sons Ltd, a toy manufacturer of Tiptree, Essex, wished to automate their payroll. They had a tradition of paying their employees by cheque which the local shops within the village would gladly take and give change in cash. I selected the following configuration for them on which to run their new payroll system:

Not having had my own ITT 2020 any length of time, I had not yet developed any software for it. I therefore bought-in a suitable payroll package which I adapted to print employee pay directly onto pre-printed continuous stationery cheques. These I designed myself and had them printed by a specialist printer. Over the next few years, I updated their payroll fixed data.
The management of Jaguar Communications plc wanted clear tabular and graphical representations of their sales orders for the current month, financial year to date and the trailing 12-month period. The software was to run on a Novell-based network of IBM compatible PCs. The required sales order information was available as a printed report which listed the details of each individual sales order for the period concerned. The report was a normal output from the accounting package they used called MicroFACTS.
I wrote a program module to extract the values of the required sales orders from a text file image of the MicroFACTS printed sales orders report. This required scanning the text for strings such as column headings or constant annotations from which each necessary value-field could be located and captured. The program then accumulated these values in a 3-dimensional array file of which the three axes were: product type, market sector, and sales rep. I then wrote other program modules which extracted the accumulated sales order values from the array file and displayed — in tabular and percentage bar-chart form — the order revenue, number of units ordered and profit for:
An example of the kinds of displays produced is shown below. A printed analytical management report combining all the above was also provided.

Jaguar Communications plc needed an Equipment Register to create a permanent record for each equipment unit received into stock, allowing it to be continually updated to reflect the unit's status throughout its entire operational life with details of its sale, installation, maintenance, repairs, enhancements and modifications during its warranty period and beyond. The system also had to provide criteria-selectable management reports and was to run on a Novell-based network of IBM compatible PCs to replace a dBase III system which was far too slow and cumbersome to handle this mission-critical function. I designed and implemented this system as outlined below:

The following management reports were provided and can be set to be restricted to a specified Model Code, Customer, Site, Date-of-origin range, in-house location, allocation, condition, and reason received back (if applicable).
Prints a wide one-line entry for each unit on the register showing Serial Number, Bin Number, Mfgr's Serial Number, Model Code, Description, Supplier, Location, Allocation, Condition, Why Received, Last Diary Entry, Customer Name, Customer Site, Order Number, Invoice Number.
Prints a wide one-line entry for each Model Type including Product Description, Supplier, Cost Price and separate figures for stock allocated to Maintenance, Engineering, Demonstrations, Rental Schemes and Contingency, then the total stock and its value. A summary table at the end of each report compares the actual and budgeted stock values found in each allocation category. A separate report gives the value of products which have been flagged as slow-movers.
The client (News Technology Ltd) had produced a stock management system for a large news wholesaler on an HP3000 minicomputer and wanted to automate the gathering, processing and reporting of stock information directly from the news retailers served by their client — the wholesaler. The client asked me to produce IBM PC & Psion Organiser software to achieve this objective within the configuration shown below:

After learning the Psion Organiser's programming language, OPL, I wrote programs to allow a news agent or rep to: view a file of all the magazine titles carried by the wholesaler, enter and amend the Week Number and the end-of-day unsold quantity for each magazine flagged for stock monitoring, and transmit these quantities via a modem when called each night by the wholesaler's remote PC. I then wrote and implemented PC software in QuickBASIC to do the following:
Import a titles text file produced by the HP3000 into a formal 'Titles Master File' file within the PC base-station.
Display/print the Titles Master File showing each title's reference number, name, period, price, and class of readership, and allow titles to be marked or unmarked for special stock monitoring.
Import a formal News Agent/Rep Master File from a text file of current news agents/reps downloaded from the HP3000 stock system.
Display the News Agent/Rep Master File showing the Box Number, Run Number and name of each news agent/rep and the telephone number the PC must dial to retrieve automatically the day's 'unsolds' figures from the news agent's/rep's Psion Organiser, plus the date and week number of the latest 'unsolds' figures received.
Transpose the current 'unsolds' figures received from each news agent/rep into the order needed for a Titles Availability report. This involved a vast file-based 'matrix inversion' process.
Display/print this report showing — for each title which is currently marked for stock monitoring — the current numbers supplied and returned unsold by each news agent or rep.
Dial-up automatically each news agent's or rep's Psion Organiser in turn overnight and upload the 'unsolds' figures for the latest day's trade.
The client required a means of viewing (in real-time) the variation with time of day of the data traffic on the four trunks connected to any 4-way X25 data switch in a large private network. A permanent record of this information had to be provided so that it could be analysed later off-line. I wrote the software in MS Quick BASIC.
My design made full use of the multi-tasking Finite State Machine programming model with which I had become familiar from my work in the public switching industry. The software was implemented on an IBM PS/2 with an X25 expansion card. Software drivers were provided with the card. The essence of the design is shown below:

The network address, location, device-type and the speeds of the attached trunks are entered into the Device Data File — and thereafter kept up to date — via the Device Data Editing Window. The Test Call Sequencer may then be activated to make X25 test calls automatically to each device on the network in turn to align each device's on-board clock to the PS/2's system time, test for alarm conditions and gather traffic data.
If the Device Data Editing Window is open while the test call sequencer is running, then as each test call is made, the device currently being tested is indicated. If an alarm condition occurs during that test call, a warning 'siren' sounds and the device's details become highlighted in red. Also an alarm window appears showing the date, time and nature of that, plus the previous 11, alarm events relating to that device. Through the Device Data Editing Window, the user can then 'acknowledge' the alarm whereupon the 'siren' stops and the highlighting turns to yellow. The user may then, when appropriate, clear the alarm.
When the Device Data Editing Window is not in view, it is replaced by two other windows: a Site Status Window which shows the name of each site and whether or not all the equipment there is currently alarm-free; and a Test Call Phase Window which indicates the current phase of the current test call. The possible phases are: prompting: the device to be called, connecting an X25 call to it, testing the device for alarms or traffic, and clearing the call.
 The Test Call Sequencer makes test calls to each network device on a continuous cycle to gather information from which it calculates and stores in the Traffic Data File the mean and peak percentages of trunk loading and logical X25 channel occupancy for each of the 1440 1 minute sampling periods in each 24-hour day. Comprehensive VGA graphics-based display and print functions allow the user to view this data in a variety of clear and concise ways.
The mean/peak percentage traffic loading on each of a data switch's 4 trunks for each of 288 5-minute sampling periods throughout a 24 hour day is displayed in a different colour. The part of the day so far gone is shown on a grey background with the plots in bright colour. The remainder has a black background and shows in dull colour the plots for that part of 'yesterday'. Once the graph is displayed, it is automatically updated in real-time as new test calls are being made. This illustration shows the percentage occupancy of a trunk throughout a 24 hour period showing the 11am and 3pm busy hours.
 Another form of display is the adjacent bar-chart showing the 'Top 10' most heavily loaded trunks on the network and gives the network manager warning as to which links of his network may need extra capacity installed. There are both screen & printed versions of these reports. A 'system heartbeat' — a heart symbol that alternates bright and dull red every ½second — shows when the graphical display is being updated in real-time from live input data. Annotated 'LEDs' are provided to show X21 signal states on the trunks connected to the device and also to show X25 call phases.
I wrote a special dual-port serial I/O function to allow COM1 and COM2 to be used concurrently — one by the Test Call Sequencer to make its on-going test calls to all devices on the network, and the other by a specially-written independent terminal window which allows more detailed tests to be made on any individual device and the capture of the whole session automatically in a capture file for later study.
Packet Switched Data Network: technical documentation project • COBOL Soft Machine: a technical sales brochure • Tendering & Ordering System: a documentation project • Accounting Package for The ITT2020: a documentation project • User Manual for The ITT3030: a documentation project • ITT System 1240 Software: wrote the System Description • Two Commissioned Magazine Articles • Generic Link Editor: software documentation project • Third World Telecommunications: a marketing brochure.
My first technical writing project after starting my own business in 1976 was to write an overview of British Steel's new private data communications network. As far as I can remember, this network was based on small Ferranti data switches for which the control software was written by Leasco.

The document included a mixture of diagrams and text outlining the principles of packet switching, the multi-layer communications protocols used, plus the network management system and its procedures. Each node of the network had the general hardware and software configuration shown. Only 2 of the 8 nodes supported mainframes which provided all services for users throughout the U.K. The other 6 nodes gave their local users access to the two mainframes via the network.
This project was originated entirely on my little Olivetti portable typewriter long before the days of PC word processing packages.
During 1977, I wrote technical marketing brochures for 4 one-off clients to market:
The COBOL soft machine was developed by Tony Sale of Alpha Systems Ltd in Bedford. The essence of this COBOL Soft Machine is shown below:

I wrote and illustrated the brochure, then subcontracted the typesetting and the printing through EBS. I later wrote a full instruction-by-instruction user guide for the above system.
Two and a half years after leaving ITT, a former colleague there contacted me to ask if I could assist in documenting a Computer Aided Tendering and Ordering system developed by Bell Telephone in Antwerp (now Alcatel Antwerp). An overview of the system is shown below:

The task was to de-compile PL/1 program listings into programming level flow charts, summarise the programming flow charts into system flow charts, and provide a system description write-up.
To assist me in this task, I subcontracted two programmers from one of my client companies, Alpha Systems Ltd of Bedford. The job involved several trips to Antwerp which I did by car and ferry taking one of the programmers with me.
Descriptive texts were derived from interviews and discussions with a Mr Rogier, of the client's development team, recorded on cassettes which we brought back to the U.K. for writing up. As a final touch, I complemented the flow charts and system descriptions by an A1 size dye-line diagram of the entire system.
The ITT2020 was a modified version of the Apple II microcomputer which was sold outside the USA by ITT Europe.
In early 1980, ITT gave me the task of writing an 80-page user's guide for the ITT 2020 Accountant — a software package specially developed for ITT by a software house owed by British Oxygen to be sold with the 2020 computer and specifically aimed at the first-time small business user.
In the book, I covered such things as the sorting out of invoices, bills and credit notes etc, the categorisation of expenditures, the entry of data and the production and interpretation of reports produced by the software. For this I used a unique schematic style of representing both objects and processes to aid understanding.
In 1982, SEL in Stuttgart produced the ITT 3030 — a Z80 CP/M based personal computer (to supersede the ITT 2020 Apple II clone) for which I had written some of the key chapters of the User Guide.
In those days, personal computers had made little penetration into business in general and practically none into medium and small companies. My descriptions therefore included an outline of the areas of a business where a computer could assist as outlined below, the software available for each area and where to obtain it.

Included was a functional description of the ITT 3030 hardware, correct use and care of the computer, do's and don'ts regarding such things as power supply, the environment in which the computer is located, and even the use, care and construction of a diskette. General procedures for using the computer and its application software in the various areas of a business were also covered.
A unique style of illustration using a mixture of schematics and semi-cartoon sketching was developed and applied for this project.
From September to October 1980, I researched and wrote a software functional overview of the ITT System 1240 Digital Exchange. This was almost immediately followed by a 5 month task of writing the software functional overview elements of the ITT System 12 Generic Bid Package for the ITT Europe International Telecommunications Centre [ITC] in Brussels, and a further 3 month task in 1984 for a real System 12 bid to British Telecom by STC.
 The System 1240 design comprised a central passive digital switch surrounded by a number of active Terminal Control Elements [TCEs] based on the Intel 8086 processor family. Each TCE serviced up to 60 digital subscriber lines (ISDN B channels) or 30 trunk or service circuits. All exchange functionality was placed in the software, which was replicated in each TCE. In large exchanges, some less time critical and less subscriber oriented functions were concentrated in Auxiliary Control Elements [ACEs} which were processing elements similar to TCEs except that they did not serve any external lines or trunks.
 One of the features of the software was that it was written in the form of message driven finite state machines [FMMs] which permit an almost unlimited number of concurrent tasks or processes. An FMM is an element of software which only activates in response to certain formal messages from other FMMs or hardware message sources.
The receipt of a valid message or sequence of messages causes an FMM to 'change state' between two of a finite number of internal logical states which reflect a condition within the exchange such as the phase of a call. Certain changes of state result in the FMM sending an output message.
One of the features of the software was that it was written in the form of message driven finite state machines [FMMs] which permit an almost unlimited number of concurrent tasks or processes. An FMM is an element of software which only activates in response to certain formal messages from other FMMs or hardware message sources.
The receipt of a valid message or sequence of messages causes an FMM to 'change state' between two of a finite number of internal logical states which reflect a condition within the exchange such as the phase of a call. Certain changes of state result in the FMM sending an output message.
From mid-1981 to the end of 1990, I devoted 15,000 hours of my time to developing a 2MB commercial software package built almost entirely of intercommunicating Finite State Machine program units based on a variant, which I originated, of the FMM principle. This software is now in place in 15 working installations, the first of which became operational in March 1986.
At the end of 1983, I spent two months writing a user guide for an Ada development environment called ACID. ACID ran on a DEC VAX and was used via a VT100-type terminal on which the screen was divided into windows:

The tool allowed the programmer to write and develop functions in the Ada programming language and then compile and run (possibly nested) functions which could be performing multiple concurrent tasks. It allowed the programmer to insert and remove break-points within his code at which the values and behaviour of variables could be observed (taking full account of each variable's scope of cross-function visibility) in a separate overlay window which could be brought into view while the functions were being run.
In July 1983, I ghost-wrote a draft article for the ITT journal 'Electrical Communications' on the designing and planning of the ITT Stand for the Telecom 83 Exhibition at Geneva. The article covered the design objectives regarding the effective presentation of the full range of ITT telecommunications products in actual operation on the stand. It included diagrams of the stand plus block schematics of the stand's special audio-visual, lighting and laser systems.
In June 1980, I wrote an article called 'Speaking to the Client in his Own Language' at the request of Steve Shirley, director of a computer consultancy organisation called F-International for publication in a computer industry journal.
The article explained that although plain words were a desirable start, they were ultimately inadequate for probing the necessary depths of concept and detail for communicating effectively with a client while doing a systems analysis of his business in order to improve its efficiency and profitability. It went on to reveal a different yet equally if not more universally understood language which is more than adequate to this task.
I have since written other articles on my own initiative, some of which have been published in the industry press; letters to Computer Weekly and an article in the Platform section.
The software of the ITT System 1240 digital exchanges was made up of units called Message-Driven Finite-State Machines (referred to as Finite Message Machines or FMMs).
 FMMs were written in a communications-oriented high-level source language called CHILL. FMM source files were kept in a Generic Source Library, from which they were compiled into relocateable object code, and placed in a Generic Object Library.
The specific functions required for a given processing element of a particular exchange were then entered into the Generic Linker/Editor which then used this information to select only those object files required for the processing element [TCE, ACE, etc] concerned.
I also spent 4 months in 1981 writing the description and user guide for the associated Generic Linker/Editor. This involved several trips to ITT's International Telecommunications Center [ITC] in Brussels and one trip to their Advanced Technology Centre [ATC] in Shelton Connecticut.
In March 1982 I spent a whole month writing a market-educating brochure directed at third-world governments and administrations covering political, financial, technological, demographic, topological, geographical and geological considerations for establishing a communications network in remote areas to pave the way for their future economic development.

Emphasis was placed on the long-term benefits of a stronger regionally-devolved economy and the resulting enhanced quality of life encouraged by a modern rural communications infrastructure.
