Ch07: Footnotes
Need for Community
Basic Human Needs
Body Fuel
Earning a Living
New Technology
Nuclear Family
Body Fuel
Human Worth
Scientific Method
Social Class
Elastic Yardstick
Team Co-operation
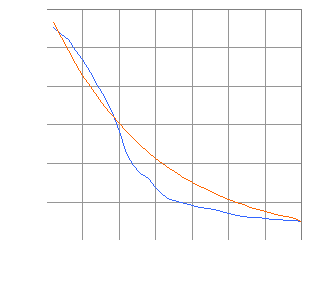
To convert an amount of money spent in a given year to the equivalent amount at the value of the £ in the year 2000, multiply the amount in that given year by the Inflation factor for that year in the table below. The table is followed by a graph comparing inflation as it is observed with inflation as predicted by the 10√2 algorithm.
| Year | Observed | 10√2 | Error |
|---|---|---|---|
| 1966 | 11·06377835626000 | 11·31371105263280 | −0·2499326963728 |
| 1967 | 10·68624281609000 | 10·55606560074560 | 0·1301772153444 |
| 1968 | 10·41866573279000 | 9·84915740280593 | 0·5695083299841 |
| 1969 | 9·84463931171000 | 9·18958873639385 | 0·6550505753162 |
| 1970 | 9·40132722389000 | 8·57418941441612 | 0·8271378094739 |
| 1971 | 8·71298872455000 | 8·00000154774441 | 0·7129871768056 |
| 1972 | 8·01468211206000 | 7·46426532825450 | 0·5504167838055 |
| 1973 | 7·44227642276000 | 6·96440576393277 | 0·4778706588272 |
| 1974 | 6·72175779484000 | 6·49802030229307 | 0·2237374925469 |
| 1975 | 5·65169072948000 | 6·06286728261638 | −0·4111765531364 |
| 1976 | 4·52169617752000 | 5·65685516150951 | −1·1351589839895 |
| 1977 | 3·92719952478000 | 5·27803245999596 | −1·3508329352160 |
| 1978 | 3·49985294982000 | 4·92457838382012 | −1·4247254340001 |
| 1979 | 3·22971285892000 | 4·59479407188166 | −1·3650812129617 |
| 1980 | 2·75607948492000 | 4·28709443073614 | −1·5310149458161 |
| 1981 | 2·39344328238000 | 4·00000051591478 | −1·6065572335348 |
| 1982 | 2·13663458776000 | 3·73213242344447 | −1·5954978356845 |
| 1983 | 2·02784404607000 | 3·48220265740141 | −1·4543586113314 |
| 1984 | 1·92516258452000 | 3·24900994162000 | −1·3238473571000 |
| 1985 | 1·84048377617000 | 3·03143344581302 | −1·1909496696430 |
| 1986 | 1·74269982133000 | 2·82842739835132 | −1·0857275770213 |
| 1987 | 1·67968044263000 | 2·63901605980956 | −0·9593356171796 |
| 1988 | 1·61951551442000 | 2·46228903311865 | −0·8427735186987 |
| 1989 | 1·51676055978000 | 2·29739688778320 | −0·7806363280032 |
| 1990 | 1·40824103001000 | 2·14354707713212 | −0·7353060471221 |
| 1991 | 1·28790043290000 | 2·00000012897869 | −0·7120996960787 |
| 1992 | 1·23284918053000 | 1·86606609138085 | −0·6332169108509 |
| 1993 | 1·20184616627000 | 1·74110121641822 | −0·5392550501482 |
| 1994 | 1·17898470317000 | 1·62450486604674 | −0·4455201628767 |
| 1995 | 1·14588067634000 | 1·51571662515894 | −0·3698359488189 |
| 1996 | 1·10998973976000 | 1·41421360797394 | −0·3042238682139 |
| 1997 | 1·08355034327000 | 1·31950794481057 | −0·2359576015406 |
| 1998 | 1·04561989280000 | 1·23114443716362 | −0·1855245443636 |
| 1999 | 1·01763297417000 | 1·14869836981279 | −0·1310653956428 |
| 2000 | 1·00000000000000 | 1·00000000000000 | 0·0000000000000 |
Year = Calendar year from 01 January to 31 December.
Observed = Inflation Multiplier as computed from observed Inflation Rates.
10√2 = Inflation Multiplier as given by the 10√2 algorithm.
Error = Error in the 10√2 algorithm's figure.
I originally based my inflation corrections on the 10√2 algorithm. This is based on the premise that the £UK has approximately halved in value every decade. This is equivalent to multiplying a price in one year by 10√2 (approx 1·07177346944809) to get what the price would be equivalent to in the following year. This yields only approximate figures for inflation. Nevertheless, it gives a far more accurate picture of reality than do uncorrected figures.
 This graph compares observed inflation (blue line) with inflation as predicted by the 10√2 algorithm (red line). The horizontal axis is the year. The vertical axis is what you have to multiply a price in a given year by to get the equivalent in £Y2K. I surmise that the rate of inflation to which the £UK naturally gravitates is determined by complex dynamical phenomena involving:
the size of the £-based UK economy relative to the $-based global economy, and
the proportional coupling the UK economy has with the global economy.
I think this would naturally follow a geometric curve which, at the moment, is somewhere close to the 10√2 curve shown in the graph. The true curve is almost certainly chaotic. Government interference with interest rates simply perturbs inflation slightly away from the natural curve, storing up fiscal tension which will sooner or later cause inflation to spring back the other way until equilibrium is restored. What such interference by government actually achieves is economic suffering among those least fortunate within society.